- If you want to change the color of the summary row for each group, right-click the left or right margin of the summary row and choose a color from the Part Color shortcut menu.
- If you want to display the name of each group in the summary row, right-click the left or right margin of the summary row, then choose Add Group Field (<field name>).
Note - You can add leading/trailing groups for
multiple fields to display different categories for each group of records.
To remove a group:
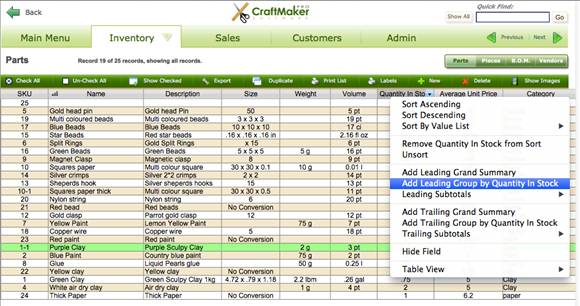
- In List View right-click the column heading for the field that you used for grouping the data, then choose Remove Leading Group by <field name> or Remove Trailing Group by <field name>.
To display subtotals:
- In List View right-click
the column heading of the field that you want to display subtotals for.
- Choose one of the options from the Leading Subtotals or Trailing Subtotals shortcut menus.
|
Select |
To |
|
Total |
Calculate the total of values in the field. |
|
Running Total |
Show the cumulative total for the current and all previous sorted groups. |
|
Average |
Calculate the average of values in the field. |
|
Count |
Count the number of records that contain a value for the field. For example, if a field contains 100 values (one value for each record), the result of the count is 100. |
|
Running Count |
Show the cumulative count of the current and all previous sorted groups. |
|
Minimum |
Show the lowest number, or earliest date, time, or timestamp for a field. |
|
Maximum |
Show the highest number, or latest date, time, or timestamp for a field. |
|
Standard Deviation |
Find how widely the values in a field differ from each other. This option calculates the standard deviation from the mean of the values in a field. |
|
Standard Deviation By Population |
Calculate population standard deviation |
|
Fraction of Total |
Calculate the ratio of the value in the field to the total of all the values in that field. (For example, find what fraction of total sales can be attributed to each salesperson.) |
A new row in the beginning of the table (for leading) or at the end of the table (for trailing) displays the subtotal for the field.
If you have also added leading or trailing groups to the table, the group summary rows also display the subtotal for each group for the specified field. You have to choose a leading subtotal to display subtotals for leading groups and a trailing subtotal to display subtotals for trailing groups.
- (Optional) To change the color of the row that displays the subtotal for the field, right-click the left or right margin of the row, then choose a color from the Part Color shortcut menu.
To remove subtotals
from Table View:
- In List View right-click
the column heading of the field that displays subtotals.
- Deselect any options
that you want to remove from the Leading Subtotals or Trailing Subtotals
shortcut menus.
- Alternately if you cannot find which headers you actually added the Subtotals to just select Reset Table View from the menu after right clicking in the header fields
Note - Removing subtotals from List View does not
remove the subtotal summary fields from the database. To remove the summary
fields from the database, choose File menu > Manage > Database, then
choose the summary fields to remove and click Delete.
Once you close or exit the program any grouping will be lost
and will have to be re-done.